
Quality is related to processes. A process is "a series of actions or steps taken in order to achieve a particular end." It doesn't matter whether the process is the handling of invoices, customers in a bank, the manufacture or assembly of parts, insurance claims, the sick passing through a hospital, or any one of thousands of other examples. A process involves movement and action in a sequential fashion.
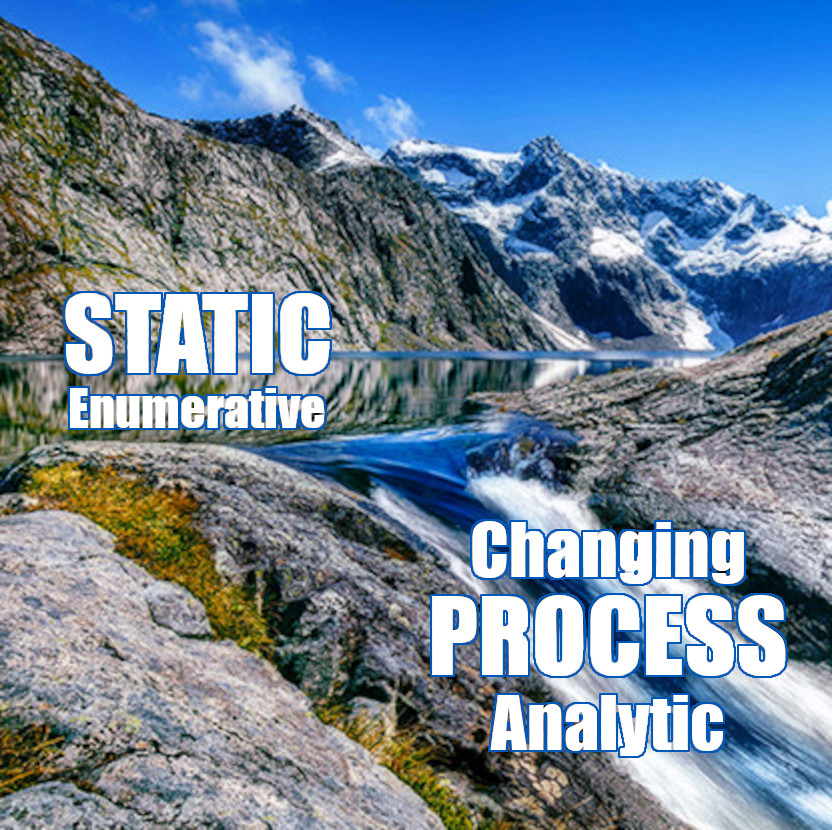
Every quality professional is concerned about the improvement of processes. By making processes better, we get less waste, lower costs, and happier customers. The image above depicts two opposed states: a dynamic, changing state and a static state. The lake is static, unchanging. We might take temperature measurements in the lake at different depths and come back tomorrow to find no difference. We might take samples of the lake water to compare with other lakes at a later date when we travelled to them.
By contrast, the stream is dynamic. It changes second to second. It is a combination of myriad chaotic processes that would take myriad Navier-Stokes equations to solve-that is, once the Millennium Prize had been won showing how to solve a Navier-Stokes equation. Measure the flow rate in different parts of the stream, and you would not be surprised to find constant changes.
The stream represents the changing and dynamic businesses with which we are all familiar and are all concerned with improving. W. Edwards Deming referred to the methods to study dynamic systems as "analytic." He referred to the lake as being studied using "enumerative" methods.
Researchers in lake compositions, psychologists, and demographers all use enumerative methods. The first use of such methods was carried out by John Arbuthnot, who published the first statistical test in 1710. Pierre-Simon, Marquis de Laplace, pioneer of the Laplace transform, in 1812 issued his Theorie Analytique des Probabilities, which laid down many of the fundamentals of statistics. Such statistics are based on the normal distribution, derived by Carl Friedrich Gauss in 1809. During the ensuing centuries, statistical tests, or hypothesis tests, were devised by men such as K. B. Wilson, George Box, David Cox, George Mood, David Mann, D. Ransom Whitney, William Kruskal, W. Allen Wallis, and Milton Friedman. There's lots of wonderful and interesting statistics. None include the element of time. They are not designed for process improvement.
Whilst enumerative methods proved powerful, they were unsuitable for dynamic, analytic situations. In 1944 Walter Shewhart made the brilliant observation that: "Classical statistics start with the assumption that a statistical universe exists, whereas [SPC] starts with the assumption that a statistical universe does not exist." That is, while enumerative statistics usually rely on assumptions about the distribution of data, commonly the normal distribution, the prediction of the behavior of processes does not. We can never know the distribution for a changing process.
Shewhart's discovery was that classical, enumerative statistics were inappropriate for process improvement. On this basis, he created the control chart for analytic analysis.
This led Deming to state in 1986 that "The student should avoid passages in books that treat confidence intervals and tests of significance, as such calculations have no application in analytic problems in science and industry.... Analysis of variance, t-test, confidence intervals, and other statistical techniques taught in the books, however interesting, are inappropriate because they bury the information contained in the order of production.... a confidence interval has no operational meaning for prediction, hence provides no degree of belief in planning."
During the 32 years since Deming's illuminating statements, the message still hasn't sunk in for most folk. Today, most process improvement courses focus on enumerative methods, that is, hypothesis testing. This is exactly what Deming warned against. Quality has regressed to the days before 1944. It is hardly surprising that a survey showed 80 percent of Six Sigma improvement projects fail (of those brave enough to admit failure).
Deming's key word for process improvement is prediction. Businesses want to be able to be sure not only that their processes will be improved, but also that they will stay that way into the future. Shewhart derived his control charts with statistical knowledge, but based on economics. His charts indicate when a process is predictable and when special causes that disrupt stability are likely to exist and should be investigated. Most important, a control chart is not a probability chart. It does not give probabilities of a process being predictable or otherwise. It does not depend on any particular data distribution, in the way that enumerative methods do.
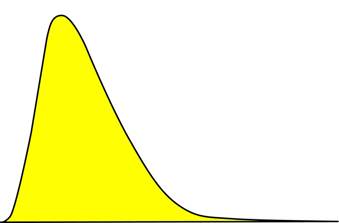
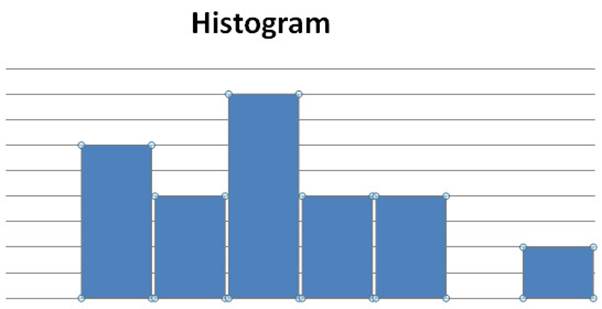
A preoccupation with enumerative methods has led many people to falsely believe data need to be normally distributed for control charting. Have a look at the data distributions below. It is difficult to imagine just what processes might produce them, but which of the processes below do you think could be charted with a control chart, without any data manipulation of any kind? That is, which can be control charted without pressing a button on ridiculously expensive statistical software to torture the data to make it confess?
Importantly, all control charts have an averages and a ranges chart. Leptokurtophobes (those fearing non-normality) will be leaping for their Librium if they care to look at the distribution for ranges in the example below (subgroup of three, calculated for normally distributed data). Despite the normal distribution for the averages chart in this example, the ranges chart is far from normal. That is, the prediction of process behavior is not affected by either averages, or ranges data being non-normal.
Q-Skills3D includes interactive games, simulations, and exercises across the gamut of process improvement. One is a ship game based on a real-world, historical story of process improvement. The game can be used for histogram and control chart training, as well as explaining the meaning of "world class quality." It does not use "defects (i.e., misses) per million opportunities (shots)" or "zero defects (misses)." These were tossed overboard into the briny 48 years ago by Genichi Taguchi, with Deming and Donald Wheeler in support. Sadly, many still cling desperately to this waterlogged jetsam of quality. Instead, it calculates an "on target with minimum variance" score for each student.
Now suppose we take the data and swap three pairs of values. Draw another control chart. It is using exactly the same data but with a different sequence. We get the result on the right, below. You might imagine this result as coming from a second gunner. He might appear to be a better gunner, but his control chart shows an out of control point. We cannot depend on his shooting. He is unpredictable.
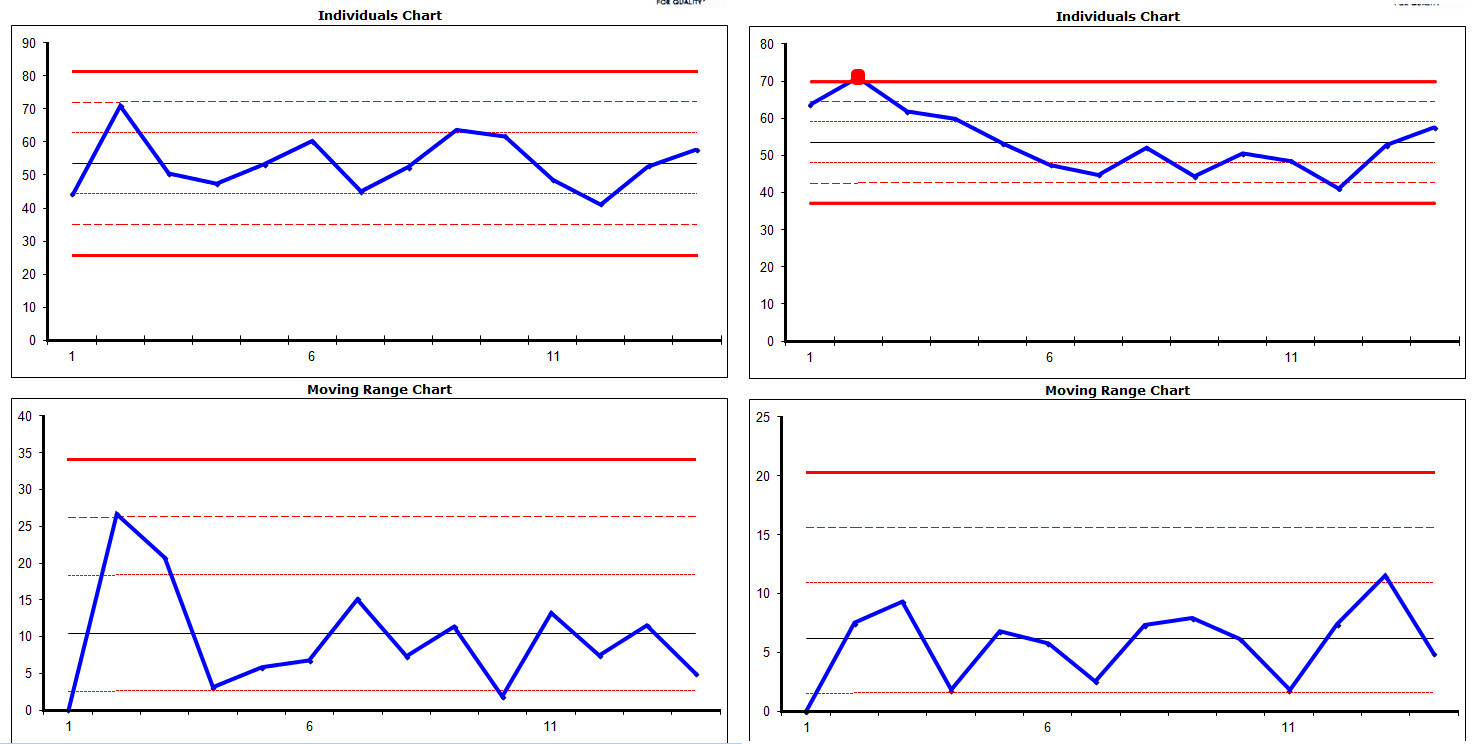
It is also important to look at the histogram for the data. The histograms are also identical, and the data are clearly nonsymmetrical. It is not normally distributed data. Enumerative methods are commonly based on the assumption of normal data, but skewed data, such as these, are fine for control charting.
Although we can eliminate special causes, such as wild shooting and inexperience, a process improvement requires a system change. This is what a clever admiral did in 1898 to achieve dramatically better quality. The ship game simulates the process improvement that he devised. Students play the game again with the process improvement, and control limits are adjusted.
It seems incredible that it took decades for such a simple yet brilliant idea to be adopted in the Navy. Yet how incredible is it that there is still such poor understanding of Shewhart's and Deming's simple yet brilliant control charts? Why has it taken so long for people to understand that processes need analytic methods, not enumerative ones? Enumerative studies are suited to studying existing, fixed populations, where the population can be fully characterized. The analytic methods of Shewhart are used to study changing processes and to predict their future behavior.
 by Dr Tony Burns BE (Hon 1) PhD (Chem Eng)