
Dr Shewhart told this story to Dr David Chambers. Dr Chambers shared it with Dr Wheeler, and he with me, and so on to you.
"When Dr Shewhart used this bowl he had operators from the plant actually draw the chips. Each operator would draw some number of chips, which were then organized into subgroups of size four and the averages and ranges were then placed on an average and range chart.
Dr Shewhart published 1000 subgroups of size four from each of three different sets of chips.So, with a total of 12,000 drawings, with replacement and stirring, this experiment took quite some time and involved several operators.
When Dr Shewhart put these data on the average and range chart he found a sequence of subgroups with points outside the limits. These subgroups had all been drawn by one operator. So Dr Shewhart had this operator come back in and draw some more chips.
Dr Shewhart could not see anything unusual in her technique, except that she took her time rummaging around in the bowl for each chip.
Her new data also had points outside the limits.
When Dr Shewhart asked her why she rummaged around to draw each chip she said: "Some of these chips feel like sandpaper and some are smooth. I only draw the smooth ones."
Having found his assignable cause, Shewhart deleted her data from the data sets published in the 1931 book."
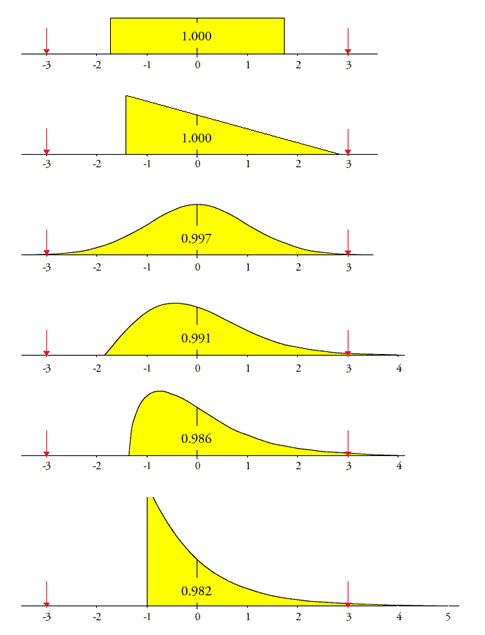
There's a number of clear messages in the story. Firstly, Dr Shewhart showed that the data distribution is irrelevant. Whether data is distributed in a triangular, uniform or bell shaped fashion, control charts work in the same way. (See the image below). You should never attempt to torture data by normalizing.
Secondly, you do not need computers to draw control charts. Drawing by hand as Dr Shewhart did, gives a better feel for the data.
Thirdly, the purpose of the control chart is to highlight abnormal situations. When points fall outside control limits, it is an alert to investigate.
Finally, involve the real process experts, the workers. The workers are the key to Quality.

 by Dr Tony Burns BE (Hon 1) PhD (Chem Eng)