
Shall I Compare Thee ...
I’ve had a colorful life with about 15 introductions to the grim reaper. The last was scariest – cancer. To know for sure, a doctor takes a biopsy. It is an intrusive test, where a small chunk of flesh is cut out and tested. The best doctors, take a minimum number of biopsies and have a maximum percent positive. How does a clinic know if there’s a doctor from whom others can learn?
Six Sigma Scammers will tell you that you need to buy snake oil. They will claim you need ridiculously expensive statistical software.
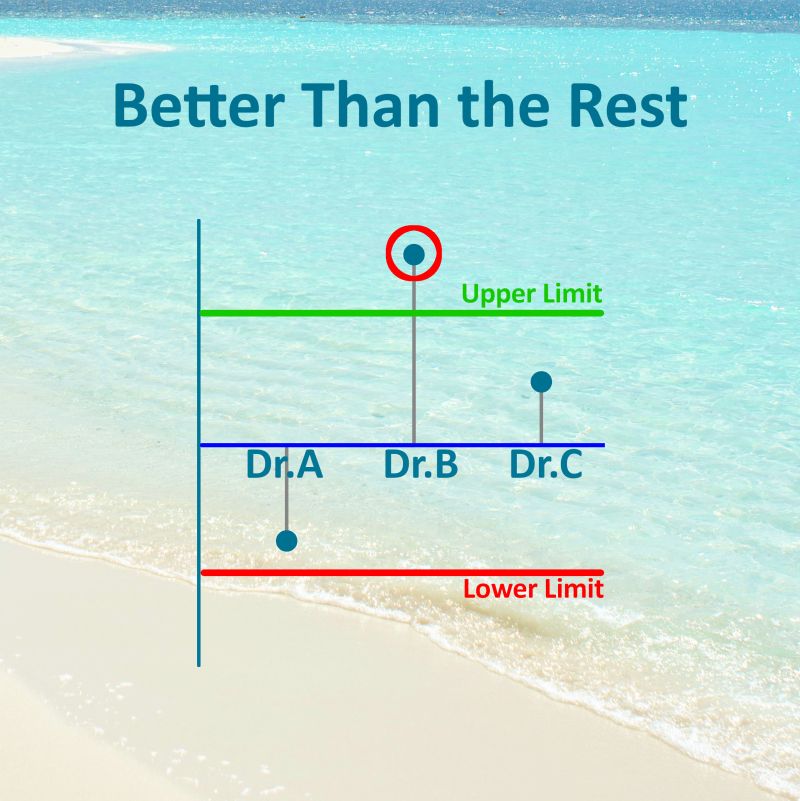
There is a better way. Keep it simple. All you need is a type of control chart, similar to an XmR. It has an overall average; an average for each doctor; and limits. Like an XmR, limits are based on the average range, multiplied by a factor. A ranges chart is drawn in a similar fashion.
This chart will identify which doctor is significantly better. Moreover, it makes it easy for management to understand, with a simple graph.
The data may be stratified, for example to compare different types of treatments by different doctors. Compare just about anything. The factors to use are given here by Dr Wheeler.
This technique, Analysis of Means (ANOM), is more powerful, and much easier to use, than the traditional approach.
 by Dr Tony Burns BE (Hon 1) PhD (Chem Eng)